From the desk
Blog
The guides explain how things work. These posts are about what it was like to learn them: the trades that went wrong, what changed afterwards, and what we would tell someone starting now.
-
The Cheap Stock That Kept Getting Cheaper
It traded at six times earnings, paid a dividend and had a plausible recovery story. Every screen said cheap. I want to explain what the screens were measuring.
-
Why I Stopped Adding Indicators
At one point my chart had six indicators on it and I could not see the price. Here is how I worked out they were all saying the same thing, and what I kept.
-
What a Year of Journaling in R Taught Me
I had kept a journal before. Dollars, tickers, a note. It taught me nothing. Recording every trade in R for a year taught me more than any book.
-
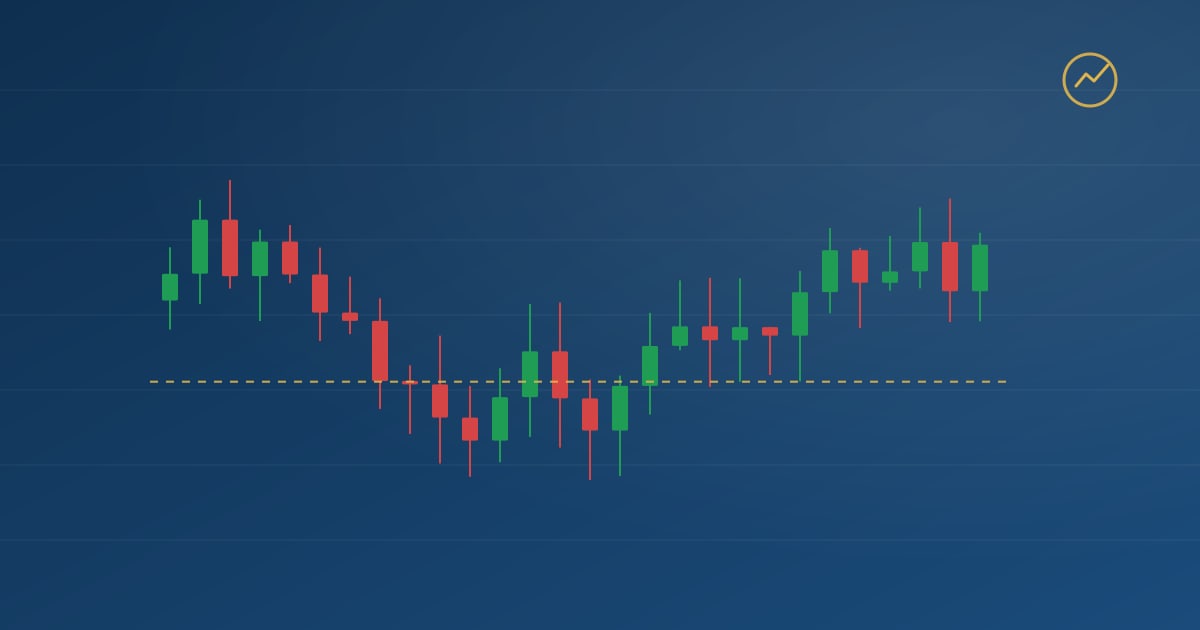
I Traded Hammers for Two Years Before I Understood Them
The hammer was the first pattern I learned and the one I lost most money on. The shape was never the problem. Where I was looking for it was.
-
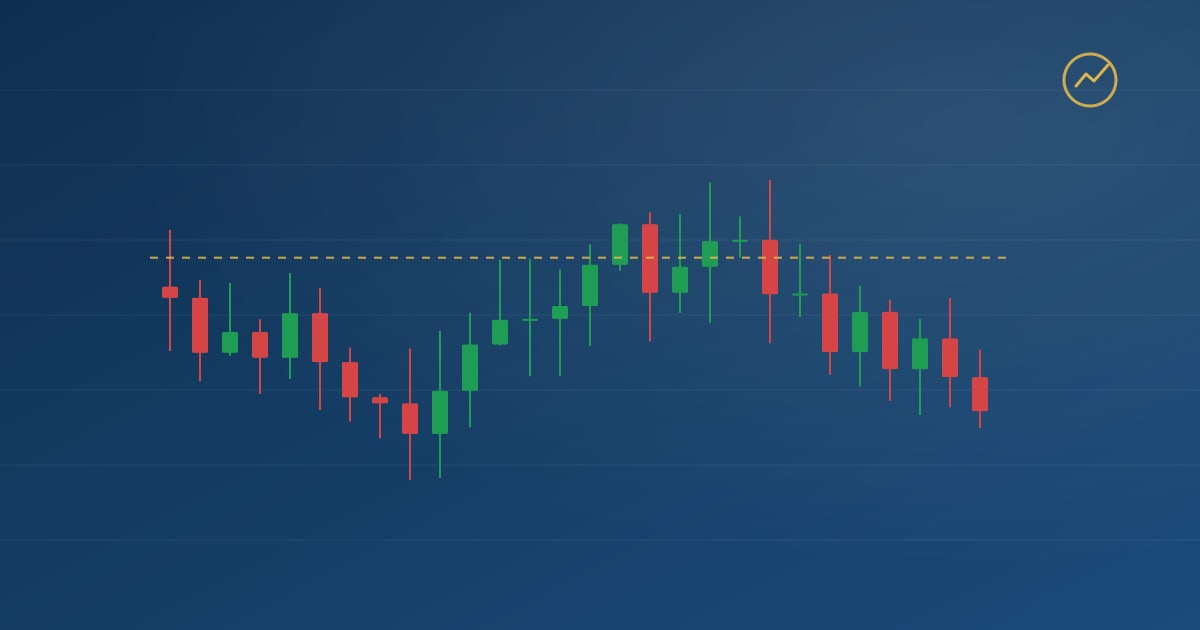
Thirty Trades Is Not a Track Record
After thirty trades and a very good month, I sized up. The arithmetic I ignored would have told me the data could not distinguish my edge from a coin flip.
Who writes here
Ellis Hartley (editor) and Graham Whitlock (senior writer). Posts here are opinion and experience; the guides are the reference material, and every post links to the ones it draws on.