Blog
Why I Stopped Adding Indicators
At one point my chart had six indicators on it and I could not see the price. Here is how I worked out they were all saying the same thing, and what I kept.
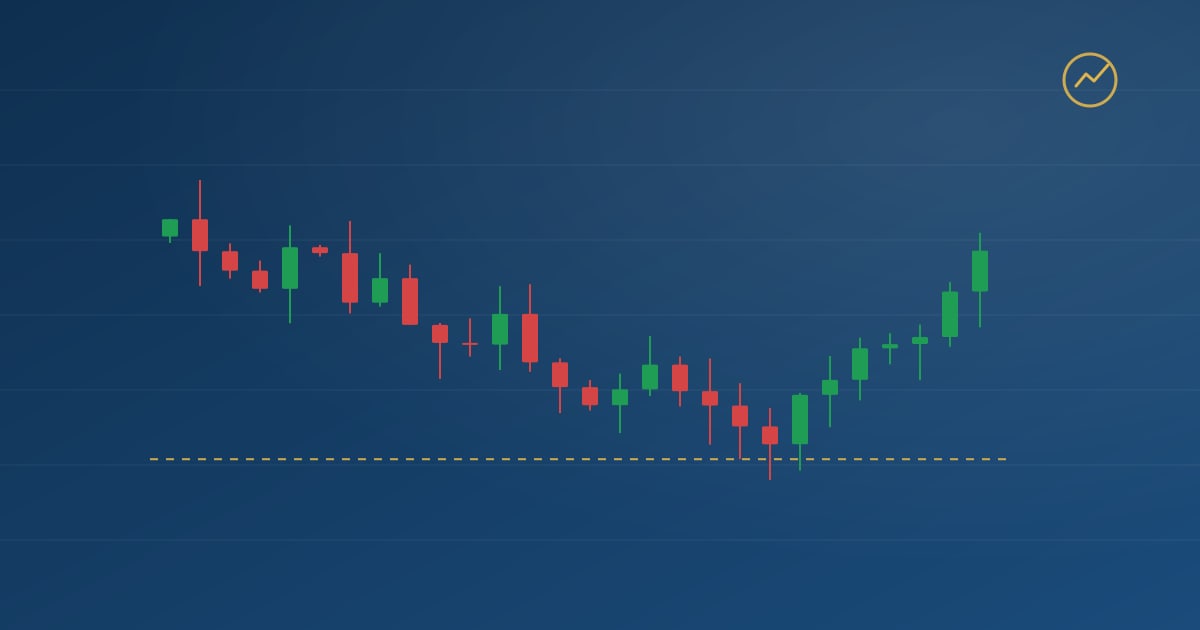
There was a period when my chart had six indicators on it. Two moving averages, RSI, MACD, Bollinger Bands and a stochastic. The candles occupied about a third of the screen. I remember feeling that this was what serious looked like.
I also remember that my results were no better than they had been with one moving average, and that I could no longer explain, in one sentence, why I was taking any given trade.
How it happened
Nobody decides to have six indicators. You add one because a book recommends it. You add another because the first one gave a bad signal and the second one, in hindsight, would have filtered it. Then you add a third to filter the second. Every addition is a response to a specific loss, and every one makes sense on its own.
What I did not notice was that each new indicator was being judged on the last trade that went wrong. That is not testing. That is fitting a chart to a memory.
The morning it became obvious
The moment I remember is unglamorous. I was looking at a stock that had been trending up for weeks, and I noticed that all six indicators were bullish. All of them. RSI high, MACD above zero and rising, price above both averages and riding the upper band, stochastic pinned near the top.
For about a minute this felt like overwhelming confirmation. Then it occurred to me that of course they agreed. They were all calculated from the same closing prices. A stock that has gone up for three weeks will make every momentum indicator look bullish, because that is what going up for three weeks does to a moving average of the price.
I was not looking at six opinions. I was looking at one fact, which I could already see from the candles, rendered six ways.
What I tested instead
I went back through my journal and asked one question about each indicator: had any trade depended on it? Meaning, was there a trade I took or skipped because of that indicator’s reading, where the reading was not already obvious from price and volume?
The stochastic had never changed a decision. The Bollinger Bands had changed two, both badly. MACD had changed a few, and in every case it was confirming a trend I could see. RSI had changed decisions in ranges, where it was useful, and in trends, where it had cost me money by making strong stocks look “overbought”.
What had changed decisions, consistently and for the better, was volume. And volume is the one thing on that chart that was not derived from price.
What the chart looks like now
Price. Volume. A 20 and a 50 period moving average, used as a trend filter and nothing else. ATR, which I do not display but use to set stop distances. That is the whole list.
The effect on my trading was not that my win rate went up. It was that I could explain every trade again. “Uptrend, pullback to a level that held before, volume dried up on the pullback, reversal candle, stop below the level.” One sentence. When I could not fill that sentence in, I did not have a trade, and no indicator was going to supply one.
The other effect was that I stopped taking trades in ranges by accident. Six indicators will always find something to say about a sideways chart. Price and volume, looked at honestly, mostly say nothing, which is the correct thing to say about a range.
What I would tell someone starting
Pick one indicator, learn how it is calculated, and use it for one job. For most people that should be a moving average, used only to decide which direction you are allowed to trade.
Add a second only if you can name a decision it will change that price and volume cannot. ATR for stop distances passes that test. Almost nothing else does.
If you find yourself adding an indicator after a loss, stop and write down what the loss was. It is nearly always a sizing problem, a range problem, or a discipline problem, and none of those is fixed by another line on the chart.
The indicators section covers what each one measures and where it fails, and how to read a stock chart is the top-down order I use now, with the indicators in their proper place at the end.