Blog
I Traded Hammers for Two Years Before I Understood Them
The hammer was the first pattern I learned and the one I lost most money on. The shape was never the problem. Where I was looking for it was.
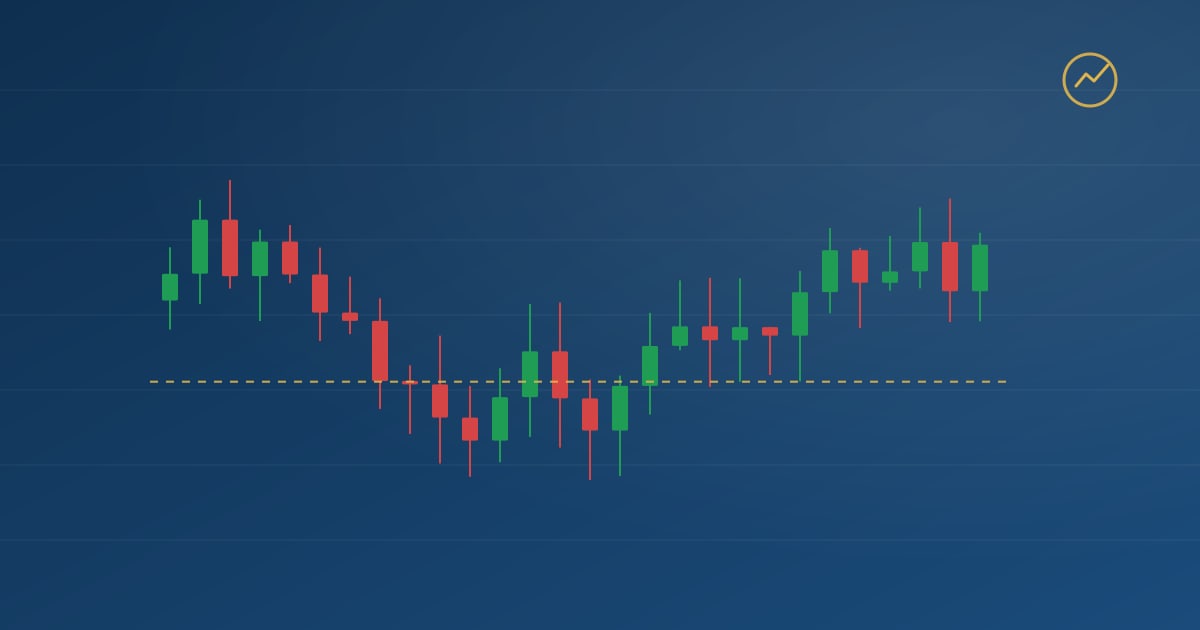
The hammer was the first candlestick pattern I learned. Small body at the top, long lower shadow, appears after a decline, buyers rejected the lows. It is a good pattern and the guide to it on this site is one I am happy with.
It is also the pattern I lost the most money on, for about two years, and I want to explain exactly how, because the mistake is common and it has nothing to do with the candle.
What I was doing
I had a scan. Every evening it returned a list of stocks that had printed a hammer that session. I would go through the list, pick the cleanest-looking shapes, and buy the ones that confirmed the next morning with a stop below the hammer’s low.
Some worked. Many did not. The ones that did not usually failed in the same way: price would confirm, drift for a session or two, then roll over and take out the low. Not a dramatic failure. A slow one. I put it down to variance for longer than I should have.
The chart that changed it
The moment it clicked was not a trade. It was two charts side by side.
Both had printed a hammer. On the first, the hammer’s low sat exactly on a level where the stock had bounced twice in the previous four months. On the second, the hammer had formed in the middle of nothing, about halfway down a decline with no prior structure anywhere near it.
I had bought both. The first had worked and the second had not, and I had recorded them as one winning hammer trade and one losing hammer trade, as though the candle were the variable. Looking at them together, the candle was the one thing that was the same. Everything that mattered was different.
What I had backwards
My process started with the shape and then looked for context. That order guarantees you find hammers everywhere, because in a falling market long lower shadows print constantly. Then you go looking for a reason to like each one, and a reason can always be found.
The right order is the reverse. Mark the levels first, on a chart with no position in it, ideally days before anything happens there. Then wait for price to reach one. Then, and only then, ask what the candle looks like.
When I flipped the order, two things happened. The number of hammer trades I took fell by something like three quarters. The ones I took worked far more often. I had not learned anything new about hammers. I had stopped trading the ones that were never trades.
The other things I had wrong
Looking back through the journal from that period, the level problem was the big one but not the only one.
I was ignoring volume. A hammer on heavy volume means real buying absorbed the selling. A hammer on light volume means the market drifted down and drifted back on a thin afternoon. The shape is identical and the meaning is not. I had never looked.
I was also treating confirmation as a formality. The guide says to wait for a close above the hammer’s high, and I did, but I treated the confirmation candle as a green light rather than as evidence. A confirmation that barely scrapes above the high on falling volume is weak evidence. I took those trades at full size.
And I was sizing every hammer trade the same, even though a hammer with a long shadow has a wide stop and a hammer with a short one does not. The position size calculator would have told me that in a second, if I had been using it.
What I do now
Levels first. I keep a short list of stocks with marked levels, and I do not run a hammer scan at all any more. If price reaches a level on my list and the session prints a rejection candle, that is a hammer worth looking at. If the same candle prints anywhere else, I do not see it, because I am not looking.
Volume gets checked before the shape does. Confirmation gets judged, not ticked. And the share count comes from the shadow length, because that is where the stop goes.
The pattern is the same one I learned in the first week. It took me two years to learn where to stand while looking at it. If you are starting, read support and resistance before you read any candlestick guide, including mine. The candle is the last thing you look at, not the first.