

Blog
Check the Broader Market Before You Buy the Stock
A stock is a boat and the market is the tide. A good boat in a falling tide still goes down, only a little later, and most of the time the tide is the larger of the two forces.
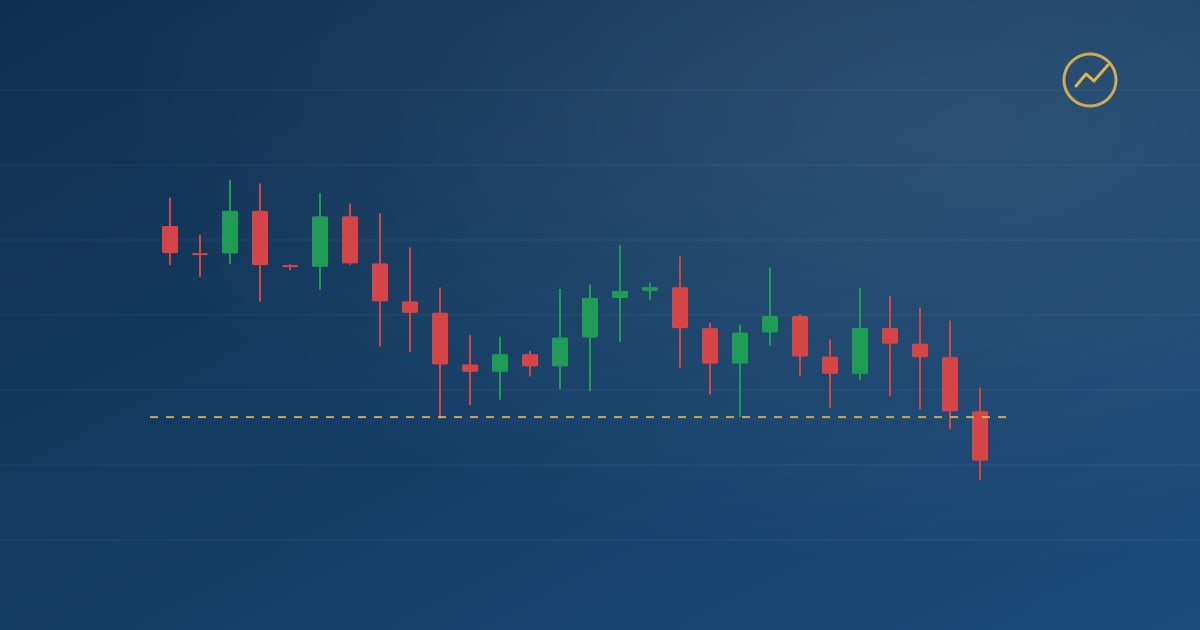
Ask what fraction of a typical stock’s daily move can be explained by the market as a whole and the answer, for most large and mid caps, is a substantial one. The company’s own news is usually the smaller part of the story on any given day. The tide is the larger part.
That has a direct consequence for anyone selecting individual names: the first chart to read is not the stock’s.
Why the tide dominates
Most of the money in the market is managed in baskets. Index funds, sector funds, factor strategies and risk models buy and sell hundreds of names at once for reasons that have nothing to do with any one of them. When that money moves, every stock in the basket moves with it, regardless of what the individual company did that day.
A stock with a clean setup on a day the index is falling hard is therefore a good idea fighting a large flow. It may well fall less than the market. It will usually still fall, and falling less does not pay.
I would put it this way: a strong stock in a weak market is a candidate for the list of things to buy once the market stops falling. It is not, on that day, a buy. That distinction accounts for a fair share of the difference between a good watchlist and a losing month.
The one-minute check
No model is needed. Before opening any individual chart:
Look at the index on the daily timeframe. Above a rising 50-day average and making higher lows suggests the tide is with long positions. Below a falling one and making lower highs suggests the opposite, however attractive the company.
Look at breadth, if you have it. If the index is rising while the share of stocks above their own 50-day average is falling, the advance is narrow and the tide weaker than the headline implies. The market internals guide covers this in detail.
Look at the current session. An index down more than a percent by mid-morning is a day to be selective or absent, whatever the individual chart shows.
An illustration
Take a journal in which trades are tagged “market down, stock strong.” Individually, each one feels like an edge: the one name holding up while everything around it falls. Collectively, such trades behave like a weaker version of the index. The stocks do hold up better. They still decline, the stops still hit, and the ones that eventually rally often do so after the position has already been closed.
The blunt rule that addresses this is: no new longs while the index is below its 50-day average and falling. The relative-strength names go on a list, and the list is used when the index turns.
Applying it
- Begin each session with the index chart rather than a stock chart. Settle the tide before looking for boats.
- Take long setups only when the index is in an uptrend, or at the least not in a defined downtrend. Treat a falling market as a filter rather than an opportunity to find exceptions.
- Keep a list of stocks showing relative strength during market weakness. They are often next month’s leaders, and the time to buy them is when the tide turns.
- Size more conservatively on days when the index is volatile even if its direction is favourable. Correlation rises with volatility, and with it the chance that a stop is hit by a market move rather than a stock-specific one.
The technical analysis guide places market context at the top of the reading order for this reason, and relative strength beats cheapness covers what to do with the names that hold up.